A product by Iris Labs · Built on Iris
From classification
to action
Iris Insights layers domain intelligence on top of your classified point clouds — transforming LAS files into operational dashboards, risk scores, change reports, and conversational data access.
How it works
Iris Insights sits downstream of Iris. After classification, it applies a second AI layer that understands your domain — translating raw class labels into insights your operations team can act on.
- • Vegetation Encroachment
- • Clearance Measurements
- • Change Detection
- • Risk Scores & Reports
What Iris Insights gives you
Analyse
Operational Dashboards
Real-time KPIs, anomaly trends, and distribution charts — purpose-built for your domain and data schema.
Locate
Geographic Risk Intelligence
Spatial risk scoring overlaid on your classified data. See exactly where to act, ranked by severity.
Track
Automated Change Detection
Temporal comparison of consecutive classifications with automated alert generation and structured reports.
Query
AI-Powered Data Access
Ask questions in plain language and get instant, cited answers drawn directly from your Iris classifications.
A live window into your data
Every classification run updates your Iris Insights dashboard in real time — from high-level KPIs down to individual anomaly locations.
| Region / Substation | Critical Alerts | Risk Score |
|---|---|---|
| Midwest Grid A | 3 | 9.2 |
| Southern Hub B | 2 | 7.8 |
| Coastal Network C | 1 | 6.5 |
| Mountain Valley D | 0 | 4.1 |
Works across every Iris application
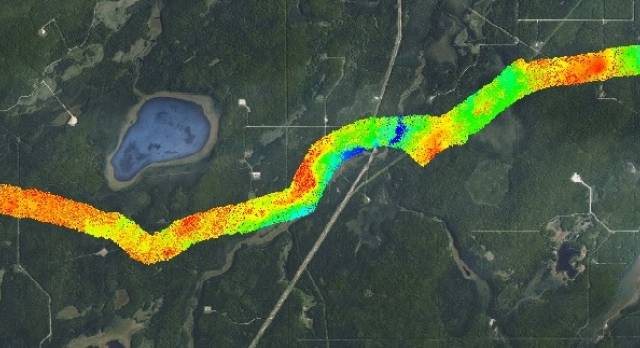
Utility & Vegetation Management
Encroachment detection, clearance measurements, and growth-rate prediction for power line corridors.
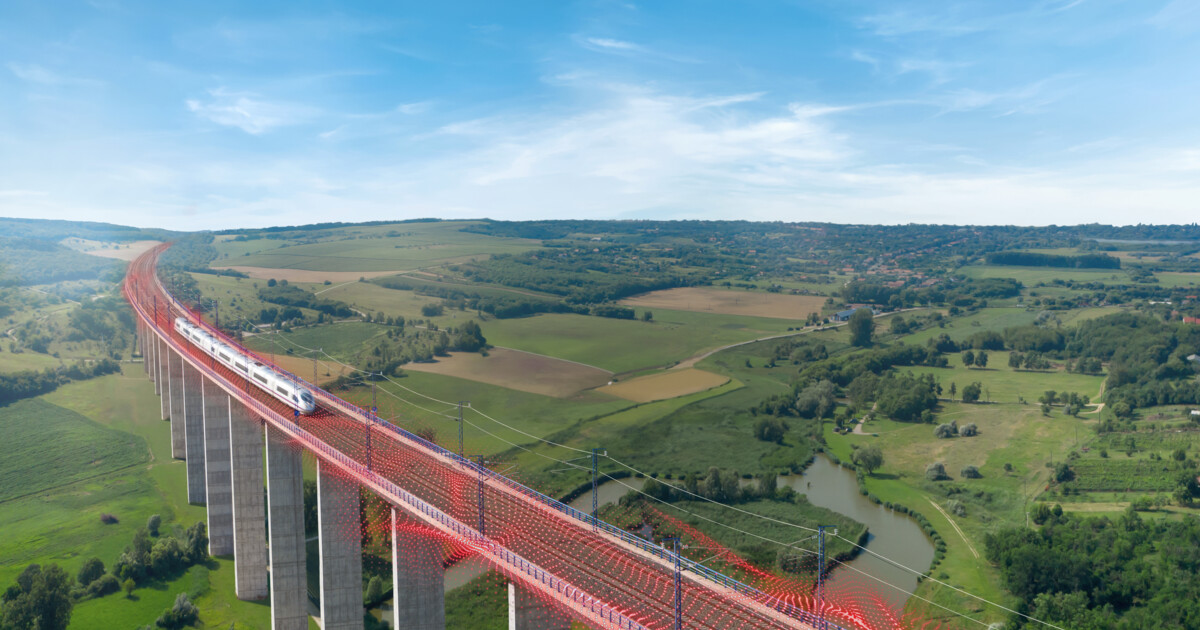
Infrastructure Risk Assessment
Anomaly scoring for bridges, pipelines, and towers — prioritised by severity and maintenance window.

Environmental Monitoring
Forest health indices, wetland change tracking, and carbon-stock estimation from classified canopy data.
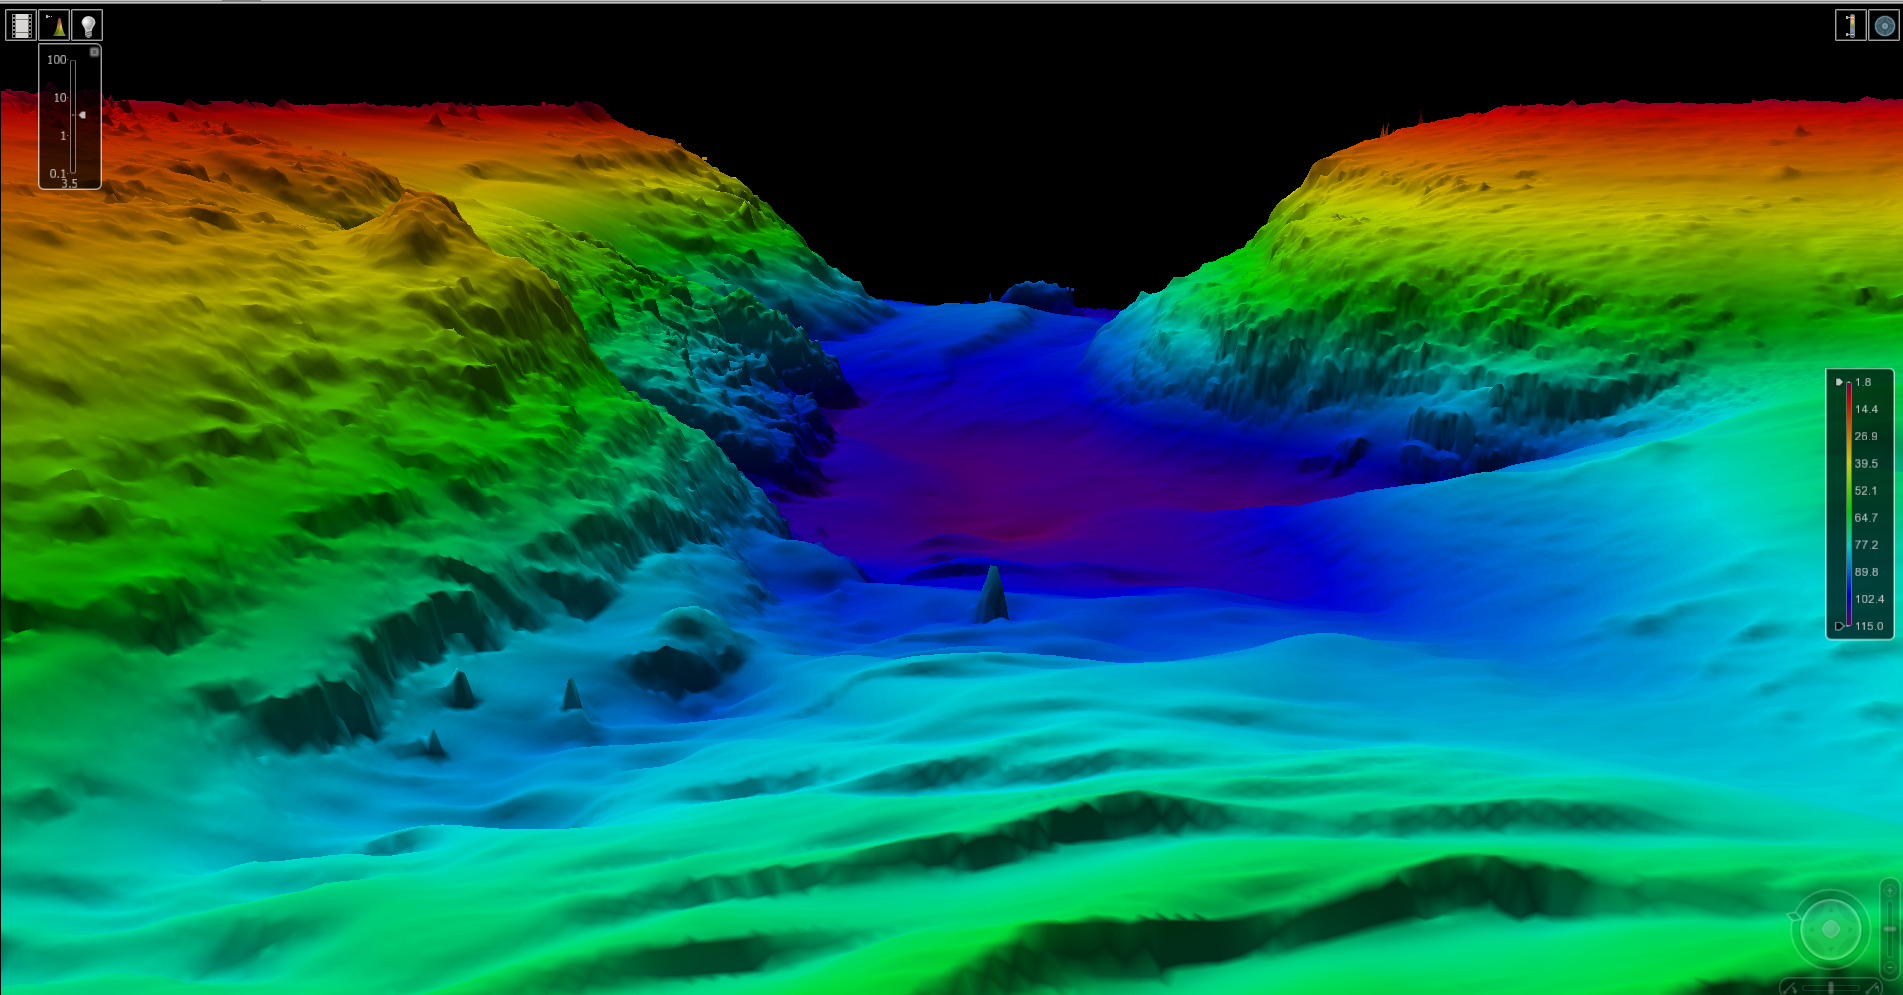
Bathymetric Change Analysis
Seabed sedimentation trends, port dredging alerts, and clearance-depth reporting over time.

Urban Development Intelligence
Construction progress monitoring, unauthorized development detection, and impervious-surface change.
Ready to turn your classifications into intelligence?
Iris Insights is currently in early access. Contact us to discuss your use case and get on the list.
Get early access